Trend-following on High Yield bonds in a rising interest rate environment
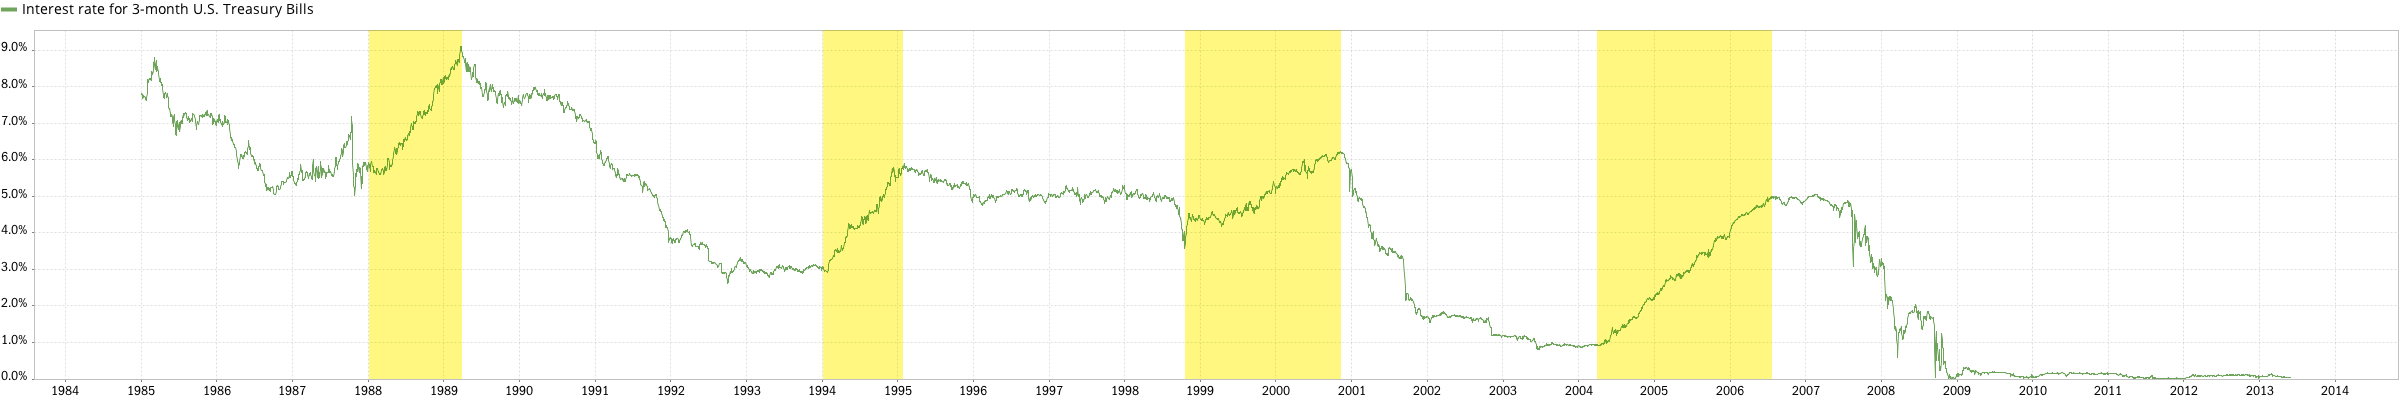
In this post, we’ll take a look at the performance of our tactical High Yield bond strategy during periods of rising interest rates. First, a brief overview. Below is a chart that shows the interest rate of 3-month Treasury Bills since 1954:
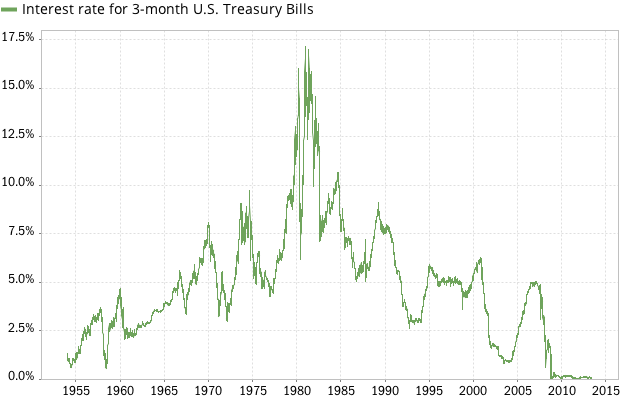
Short-term interest rates (as represented by 3-month T-Bills) have fluctuated in a wide range. After World War II, rates were very low (less than one percent). As the U.S. economy picked up steam, rates rose, reaching their all-time high of over 17 percent in 1980 and 1981. Since then, interest rates have gradually decreased, once again dropping below 1% after the Global Financial Crisis in 2008-2009.
When interest rates go up, the price of bonds (and bond funds) declines. It therefore makes sense that the high starting rates in 1981 marked the start of a 30+ year bond bull market: as interest rates fell, bond prices rose. Some market observers have suggested that we’re now at the other end of the spectrum, in a rising interest rate environment. We’ve written about negative bond returns during such periods before. This would be bad news for buy-and-hold bond investors, who have indeed been penalized recently due to a few sudden spikes in interest rates. But what about bond market timers?
While bond interest rates have generally declined, since 1985 there have been 4 periods during which they rose, as shown in the chart below (yellow highlights):
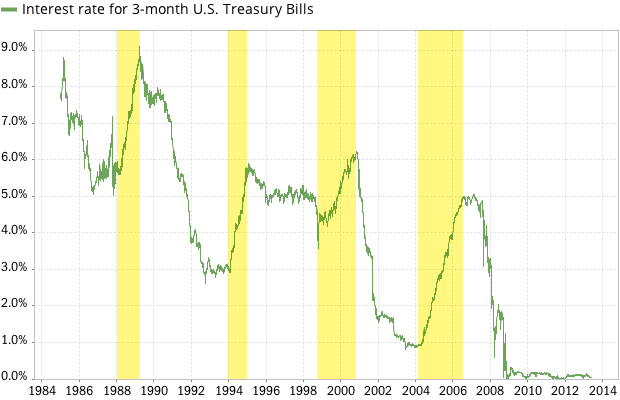
It may therefore be interesting to isolate the performance of the Yieldstream strategy during these four periods of increasing interest rates. Below are the results, in table form:
| Strategy | CAGR | Standard Deviation | Sharpe Ratio | Maximum Drawdown |
|---|---|---|---|---|
| Yieldstream Baseline (Default Strategy) since 1985 | 14.6% | 2.8% | 3.4 | -3.4% |
| Yieldstream from 1/1/1988 through 3/31/1989 | 11.8% | 3.3% | 1.3 | -1.2% |
| Yieldstream from 1/1/1994 through 1/31/1995 | 4.8% | 2.4% | 0.1 | -2.3% |
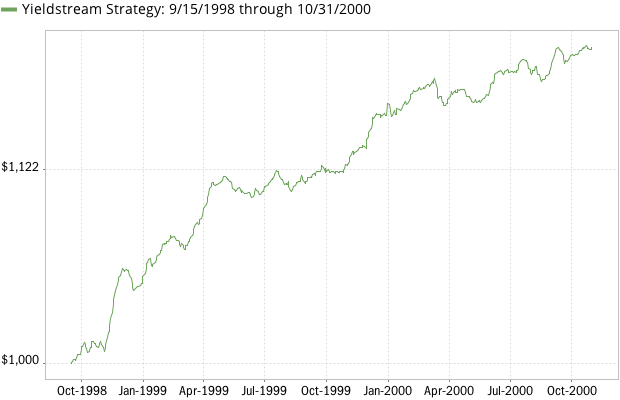
| Yieldstream from 9/15/1998 through 10/31/2000 | 9.2% | 2.3% | 1.7 | -1.6% |
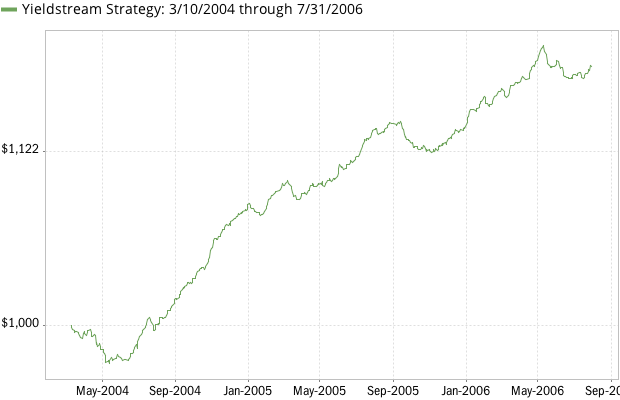
| Yieldstream from 3/10/2004 through 7/31/2006 | 7.4% | 1.9% | 2.1 | -2.4% |
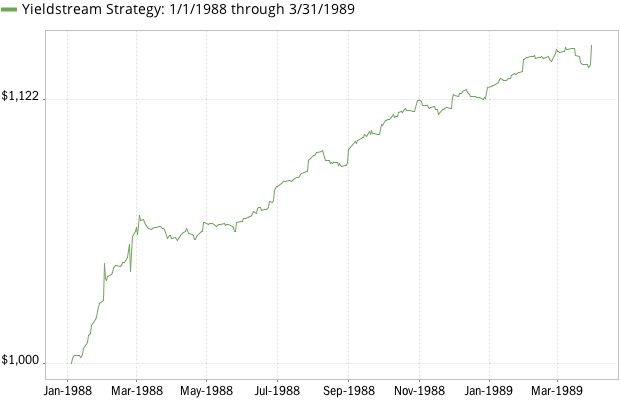
We’ll also share four strategy performance charts for each of the rising interest rate periods. Below is the Yieldstream performance during the first period of rising interest rates, starting in 1988:
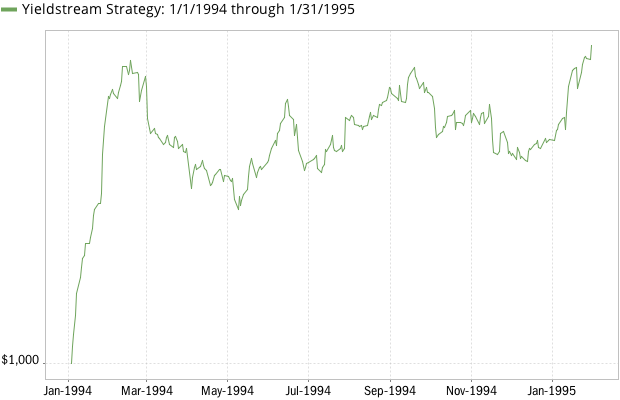
And here are the strategy returns during the second period starting in 1994:
Here are the results during the third period in 1998:
And finally, below is the Yieldstream strategy performance during the 4th period of rising interest rates between 2004 and 2006:
Conclusion
The Yieldstream strategy backtests show positive performance during all four periods of rising interest rates. The returns were lower than the long-term strategy compound growth rate (which is expected), but nonetheless outpaced short-term bond returns during all observed periods. Strategy volatility and drawdowns were surprisingly low.
It is of course impossible to predict the future and determine whether or not we’ve recently started a new long-term trend of rising interest rates, and whether this marks the beginning of a bond bear market. Time will tell.