Readers often ask whether our Yieldstream strategy works in smaller investment accounts. They inquire about the performance impact of holding just one fund at a time (instead of all 3 in our model portfolio), and wonder whether there’s any way to reduce trading expenses (brokerage fund commissions). In this post, we take a closer look at several variations on the Yieldstream strategy which address these practical concerns. We also investigate the impact of trading commissions on strategy returns.
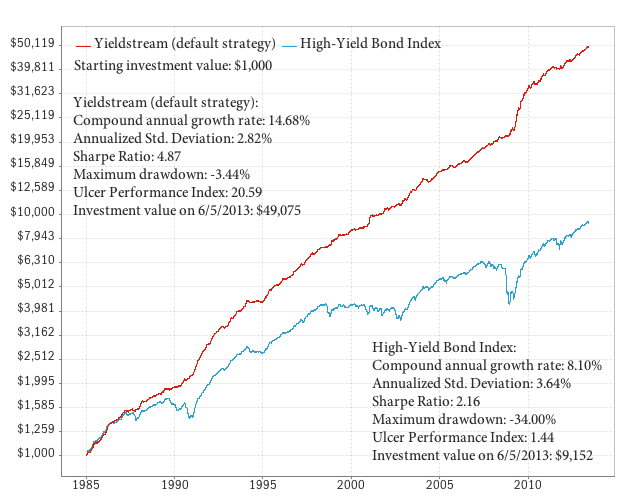
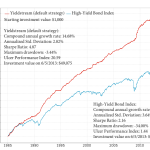
First, we’ll establish a baseline to measure all strategy variations against. Below are the performance results of the default Yieldstream strategy as of 6/5/2013. All subsequent variations are measured against this baseline and the same backtest period: [see notes]
Skip the low volatility bond fund trades
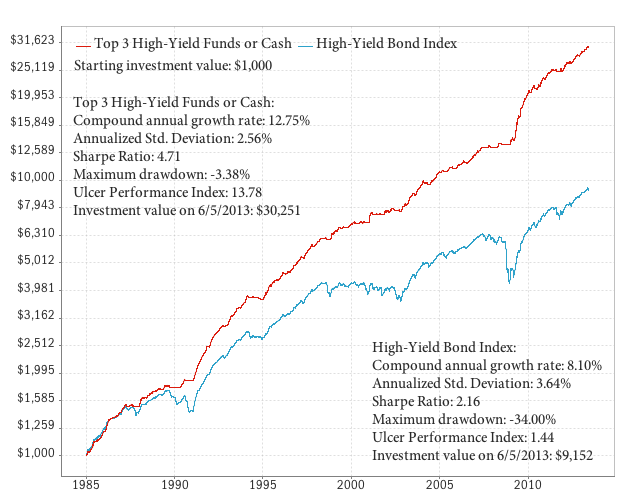
The Yieldstream model switches between low volatility and high yield bonds. But it derives most of its returns from high yield bonds. The chart below answers the question: what if you skipped all the low volatility bond trades, and just switched between high yield funds and cash? As you can see this reduces the annual returns by 1.93%, from 14.68% to 12.75%:
In an actual investment account, instead of holding cash, you can use your broker’s risk-free money market fund to boost returns. You can also buy a short term bond ETF such as SHY (but stay away from longer duration funds such as IEF or TLT, as they are more volatile). Currently, short-term interest rates are practically zero, but when they rise, this would be an efficient source of added returns. And right away, you’ve cut the cost of brokerage commissions in half — by skipping half of the strategy’s trades.
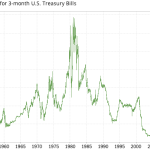
In the long run, the low volatility bond funds we’ve used have an annualized return of 5.92%, but recently, this has dropped to almost zero due to low interest rates. When rates rise — and they will eventually, remember they were 15% in the early 1980s — the price of bonds goes down. Therefore, at these levels, there's simply not much upside left in “high grade” bond funds, and plenty of potential downside.
Depending on your belief about future interest rates, it may therefore be a better idea in the current environment to skip the Yieldstream low-volatility bond trades, and substitute cash or another risk-free equivalent whenever the model sells its high yield bonds.
Buy only one high yield bond fund (instead of three)
At any given time, the Yieldstream model portfolio is invested in the top 3 bond funds (either high yield or low volatility) as ranked by our system. You can see how this works in our historical allocation table. Subscribers have asked whether they can buy only 1 bond fund, instead of three. This would be more practical for smaller accounts, and to reduce brokerage commissions. The following chart shows the results of holding only the top-ranked high yield bond fund, and switching to cash. As you can see, performance is now 12.24 percent per year, with a maximum drawdown of -4.86 percent and negligible volatility:
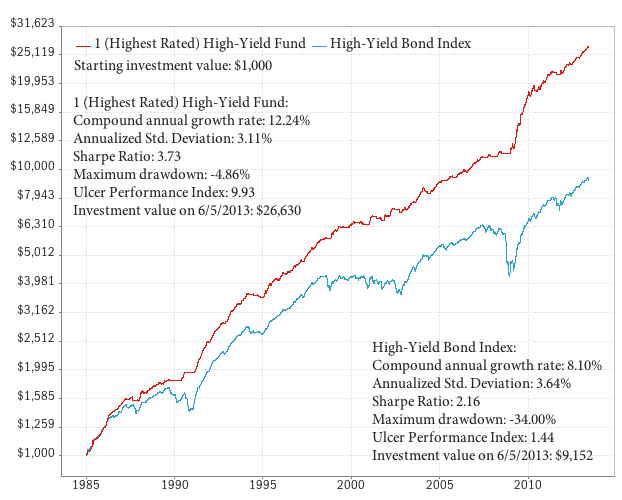
You may be wondering: OK, but what if my broker doesn’t offer the top-ranked high yield fund, and I can only buy the 2nd or 3rd top-ranked fund from your list? The table below summarizes the results for all 3 cases:
| Strategy | CAGR | Standard Deviation | Sharpe Ratio | Maximum Drawdown |
|---|---|---|---|---|
| Yieldstream Baseline (Default Strategy) | 14.7% | 2.8% | 4.9 | -3.4% |
| 1st Highest Ranked High-Yield Fund | 12.2% | 3.1% | 3.7 | -4.9% |
| 2nd Highest Ranked High-Yield Fund | 12.9% | 3.2% | 3.8 | -5.4% |
| 3rd Highest Ranked High-Yield Fund | 13.1% | 3.2% | 3.9 | -3.5% |
As you can see, during the period evaluated, it wouldn’t have made a big difference whether you bought the 1st, 2nd, or 3rd top-ranked fund from our list. Returns are very similar, but maximum drawdowns and volatility do fluctuate somewhat. In any case, by using this modified approach we have once again reduced our brokerage commissions, since we’re now buying and selling a single high yield bond fund. We’re down from 6 fund transactions in the original strategy to just one.
Investors with larger accounts may still prefer to hold the top 3 funds. High yield bond mutual funds can be volatile. Fund prices fluctuate based on the quality, duration, and liquidity of the bonds in their portfolio, as well as other factors. While our model continually attempts to select the best funds (with the best risk-adjusted returns), from historical backtests on single high yield funds we can tell you that if the model happened to choose the worst high yield fund, the maximum drawdown would have been -13.7%. So far this has not happened, but by diversifying among different funds, you can reduce the impact of one particular fund’s unusually high volatility or poor performance.
Impact of trading commissions
Mutual fund fees are one of the financial services industry’s dirty secrets. You have to be extremely careful and double check the fine print whenever you place a mutual fund trade, because brokers and fund managers are notorious for hiding fees and commissions. We try to keep up to date on the best funds to use, but every broker has different terms, and a fund that’s offered at good terms by one broker may be offered with an outragious front-load at another. So please do your homework before placing any orders.
Some funds/brokers charge a commission when you purchase the fund (typically $10 to $50). On others, you incur a short-term redemption fee on shares held less than 180 days (but these usually don’t charge an up-front commission). In any case, for the purpose of this next simulation, we’ve assumed a $50 per trade commission on buying AND selling each fund. This simple scenario assumes that the investor starts with a $10,000 portfolio, and switches between one high yield fund and cash. You can see the impact of commissions. Returns are down to 11.83%, and maximum drawdown is -5.1%:
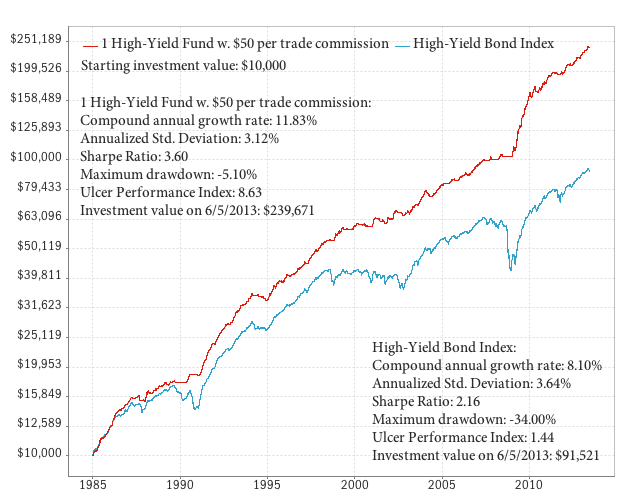
The smaller your account, the greater the adverse impact of whipsaws during range-bound markets. Luck also plays a role for smaller accounts. If you start the simulation during a period where the Yieldstream system had lots of short trades (i.e., high commissions) — for example 1998 to 2003 — then this hypothetical unlucky investor would see much higher drawdowns and lower returns for years, until the next major high yield trend starts again. Later on, as the portfolio grows in size, the $50 commissions become negligible.
So perhaps a better simulation is to assume a fixed percentage commission for every trade. The following chart simulates the return of switching between 1 high-yield fund and cash, with a 0.2% per trade commission:
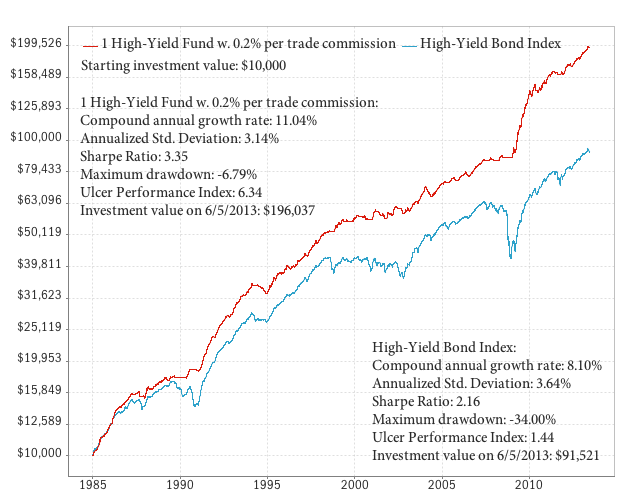
Returns are down to roughly 11% per year, and the maximum drawdown is higher at -6.8 percent. Notice the drawdown in 1994, which is much more pronounced in this scenario compared to the others. We ran similar simulations for commissions ranging from 0.1% to 0.5% per trade, and the results are shown below. These are all portfolios that switch between one top-ranked HY fund and cash:
| Strategy | CAGR |
Standard Deviation |
Sharpe Ratio |
Maximum Drawdown |
|---|---|---|---|---|
| Yieldstream (Default Strategy) | 14.7% | 2.8% | 4.9 | -3.4% |
| 0.1% commission per trade | 11.6% | 3.1% | 3.6 | -5.7% |
| 0.2% commission per trade | 11.0% | 3.1% | 3.4 | -6.8% |
| 0.3% commission per trade | 10.4% | 3.2% | 3.1 | -8.3% |
| 0.4% commission per trade | 9.8% | 3.2% | 2.9 | -9.7% |
| 0.5% commission per trade | 9.3% | 3.3% | 2.7 | -11.2% |
As expected, the performance of the high yield strategy decreases with rising commissions. Ideally, the account should be large enough so that the effective commission per trade is 0.3% or less. At 0.5%, the returns of the system were still slightly better than buying and holding the high yield index, which had a CAGR of 8.1% over the same period. Perhaps the risk protection (smaller drawdown) adds the most value at these high commission level. As pointed out before, with a 0.5% commission, the system can be flat for years at a time, e.g. during 1998-2003.
If the notion of a percentage-based commission per trade is confusing, here’s an example: Let’s say you have a $10,000 account, and you plan to trade a single high yield fund. If the commission per trade is $50, this represents a 0.5% commission (50/10,000). If your account is $25,000 the per trade commission goes down to 0.2%, and a $50,000 account means you’re paying a 0.1% commission. If you plan on trading a much larger account, then the $50 per trade commissions pretty quickly become negligible.
Conclusion
We’ve shown that a modified version of the Yieldstream strategy is still very effective for investors wishing to skip the low volatility fund trades, and that this may actually be preferable under current bond market circumstances. Investors can also switch between as few as 1 high yield fund and cash, and still end up with respectable strategy performance. With these variations, you can drastically cut the cost of commissions and fees, making Yieldstream a practical strategy even for small investment accounts. As always, the information in this post is not investment or financial advice. [Disclaimer]
If you have any questions or comments, please drop us a line.
Notes
- Yieldstream was made available to subscribers on 7/7/2011. Performance results before this date represent a hypothetical strategy backtest.
- The Sharpe Ratio for all reports in this post is higher than usual, because we used a zero percent risk free interest rate in that calculation. But since we’re using it only as a comparative measurement here, that’s OK. Normally, we use the actual rate of return of T-Bills, which leads to lower Sharpe Ratios.
Comments
To add a comment, please Sign In.