Trend-following on high-yield bonds
Trend-following is an active investment strategy that works well on many different asset classes such as stocks, bonds, real estate, commodities, and currencies. The effectiveness of trend-following is supported by academic and practitioner research, published in hundreds of papers and investment books over the past decades. We won't attempt to summarize the trend-following literature, but encourage investors who are unfamiliar with this approach to learn more about it, starting with the brief bibliography below.
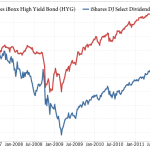
Trend-following works on bonds in particular because bond market leadership rotates with changes in the economic environment. During favorable economic climates, capital flows into high yield bonds because of their yield advantage. But during periods of economic weakness, investors emphasize safety rather than maximum return, so demand for safer bonds like U.S. Treasury issues increases. This leads to well-defined price trends, which can be captured with a trend-following strategy like Yieldstream.
The Simple Moving Average (SMA) is a popular trend following indicator. It filters out the day-to-day noise in security prices, revealing the longer-term trend. SMAs have been tested on hundreds of different time periods, asset classes and markets (going back to the 1800s and before where data was available). They are a reliable mechanism to manage downside risk in volatile investments, often improving risk-adjusted performance.
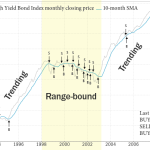
The following chart shows the monthly closing price of a typical high yield bond fund, along with its 10-month SMA:
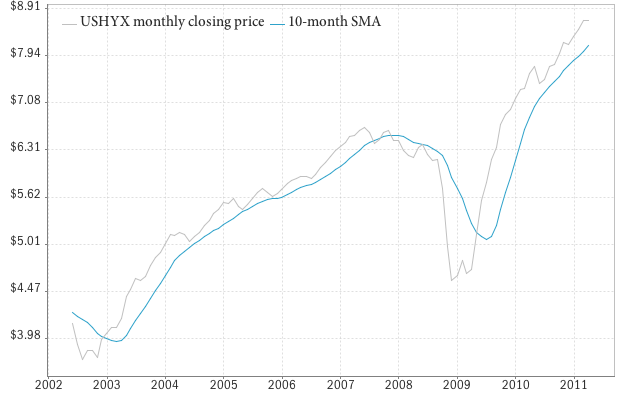
Note: we use a more sophisticated trend-following approach for the Yieldstream strategy, but this simple SMA example serves to illustrate the benefits of trend-following. The fund we use in this example is USAA High-Yield Opportunities (USHYX), but this approach works well on other high yield bond funds, and other asset classes, as documented extensively by others.
Bond investors can use the SMA as a signal to time the buying and selling of a security. In an upward trend, the investor buys the security when its monthly closing price crosses above the SMA, rides the trend, and then sells it when the trend direction reverses and the price crosses below the SMA. Below is the same chart as before, with the Buy (B) and Sell (S) trading signals added. As shown, using a 10-month SMA on the USHYX fund would have signalled the investor to SELL on 11/30/2007, stay out of the 2008 bear market, and BUY again on 05/29/2009:

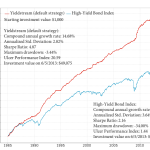
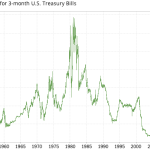
Now lets use these BUY/SELL signals in a simple market timing system with the following rules: Buy the USHYX fund when the monthly closing price rises above its 10-month SMA. Otherwise, sell it and invest the proceeds in T-Bills (a risk-free investment). The results are shown below:

The SMA strategy shows a compound annual growth rate (CAGR) of 11.02%, turning an initial investment of $1,000 in June 2002 into $2,518 by March 2011. By comparison, buying and holding the USHYX fund over the same period would have resulted in a CAGR of 8.73%, and and ending investment value of $2,094.
Lets look at some of the other details:
Annualized Standard Deviation for the strategy (a measure of investment volatility) was 5.44%, compared to 9.78% for buy/hold.
Sharpe Ratio: the SMA strategy's risk-adjusted return, as measured by the Sharpe Ratio, was 1.58, compared to 0.70 for buy/hold. When comparing two strategies, a higher Sharpe Ratio is better.
Maximum drawdown: the SMA timing strategy experienced a maximum drawdown (peak-to-trough decline in investment value) of only -4.86% during this period. By comparison, an investor who bought and held the USHYX fund through the 2008-2009 financial crisis would have suffered a maximum drawdown of -31.23%.
The Ulcer Performance Index (UPI), one of our favorite performance metrics, compares the strategy returns to its drawdowns. When comparing two strategies, a higher UPI is better. The SMA strategy had a UPI of 6.31, compared to 1.08 for buy/hold.
Monthly data: this example uses monthly data, and timing decisions are made only once a month, on the last day of the month. Other timing strategies use weekly or daily data, which tends to generate more frequent trading signals.
Conclusion
Using a systematic trend-following approach to time the buying and selling of high yield bond funds significantly improves investment returns, and lowers volatility and risk. SMAs provide a simple example of these benefits. Performance can be further improved with more sophisticated trend-following and portfolio composition techniques, such as those used in the Yieldstream strategy, leading to superior risk-adjusted returns.
Selected Bibliography on Trend-following
- On the Nature and Origins of Trend Following – Stig Ostgaard, Last Atlantis Capital Management
- A Quantitative Approach to Tactical Asset Allocation – Mebane T. Faber
- The Ivy Portfolio: How to Invest Like the Top Endowments and Avoid Bear Markets – Mebane T. Faber and Eric W. Richardson
- Trend Following – Michael W. Covel